Enjoy this content?
Click to make it sunny!
Introduction
El Niño and La Niña describes the warm and cool phases of a cyclical climate pattern driven by ocean water temperatures and barometric pressure. These patterns have been occuring for centuries; however, their formation and impact on our season weather are often misunderstood.
TL;DR
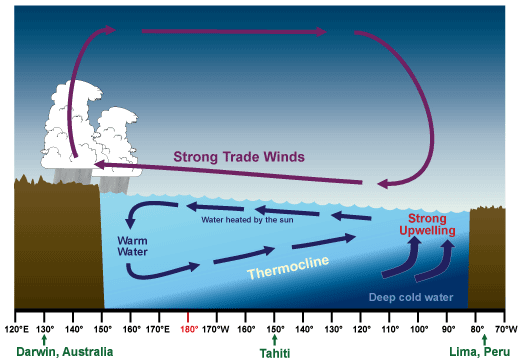
La Niña describes a pattern where ocean water in the central Pacific is cooler than average. Strong Trade Winds push warmer air past the west Pacific allowing it to cool from the east, resulting in increased storms and regionally lower pressure over Indonesia. This weakens the Subtropical Jet Stream. In the USA, these conditions support cooler/wetter conditions in north and drier conditions in the south.
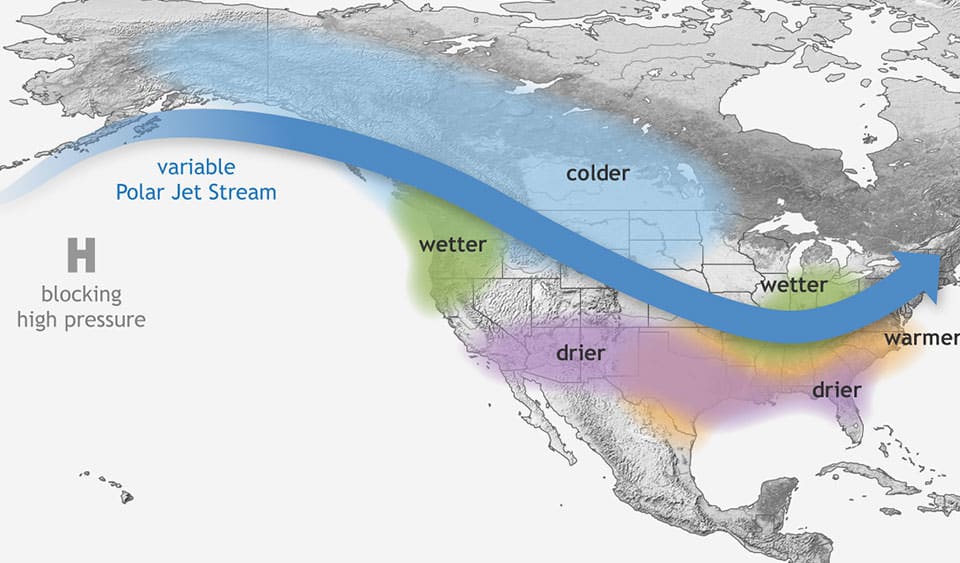
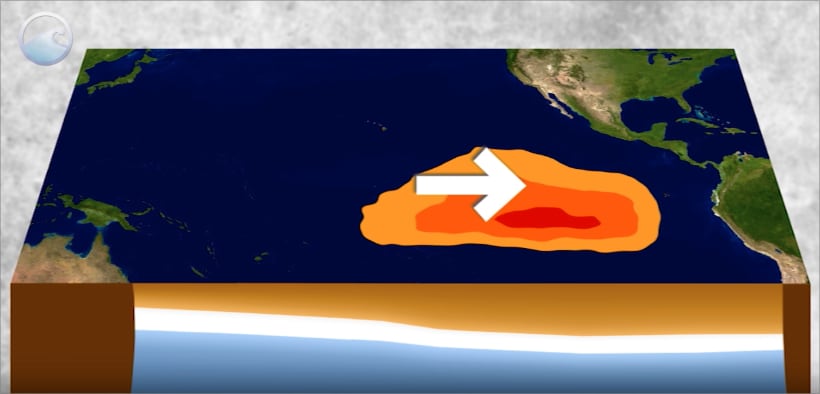
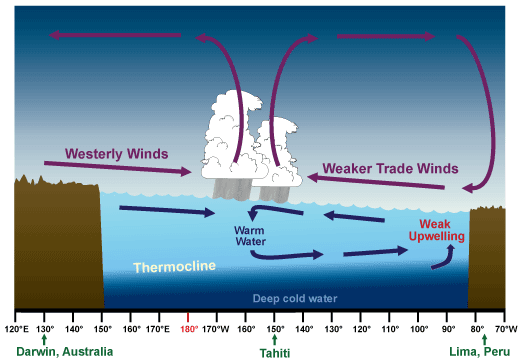
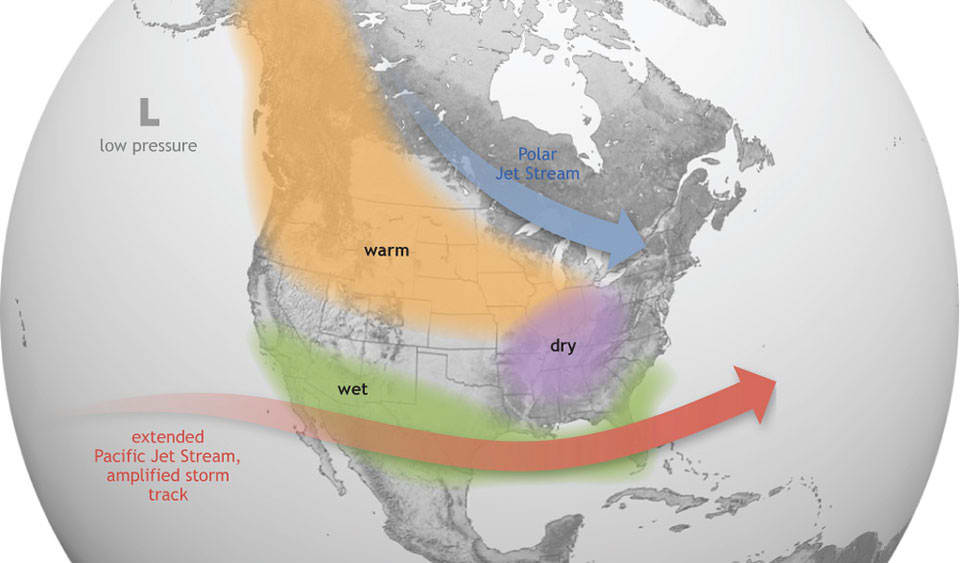
El Niño describes a pattern where ocean water in the central Pacific is warmer than average. Weak Trade Winds allow pools of water to drift away from the west and warm the central Pacific. Support for storms, and resulting lower pressure, shifts east as well. This causes the Subtropical Jet Stream to strengthen . In the USA, these conditions support warmer/drier conditions in north and wetter/stormier conditions in the south.
If you want to dig in and learn a bit more about La Niña/El Niño and the climate phenomena that impact them, you’re in the right place!
Note from the author:
I want to first acknowledge that ENSO is complex .
I know there will be readers that find some of the content long or difficult to understand, while others will criticize it for leaving out details. My intent is to go deep and be as thorough as I can based on my research, while still keeping it accessible to all audiences. - That is an incredibly difficult balance (and very time consuming).
At the risk of writing ‘over-simplification’ a hundred times on this page, I wanted to acknowledge it here.
I’ve broken the content up into sections to help navigation. If you find an error or a section that could use more explanation, constructive feedback is always welcome!
I hope you enjoy and take something away! Ok, Let’s go!-Eric
ENSO Introduction
ENSO , which stands for El Niño-Southern Oscillation , describes the largest year-to-year change of climate on Earth. While many of the weather phenomena that influence ENSO originate in the tropical Pacific, changes in ENSO have massive impacts on weather across the world. This can lead to prolonged droughts, heat waves, floods, hurricanes, and other such events.
As the name implies, ENSO is a pairing of two major cyclical phenomena:
- E l N iño and La Niña - changes in temperature of equatorial Pacific ocean water
- S outhern O scillation - changes in atmospheric air pressure near the equator
There are actually many other factors that play into ENSO, but the two mentioned above have the strongest link to one another. All of the components discussed below will tie back to temperature or pressure .
Climate Components
Disproportionate Heating
Every day the sun heats the Earth. Because of the earth’s spherical shape and rotation on a tilted axis, this heating is uneven . As the Earth orbits around the sun in a non-perfect circle, this is what creates our Seasons !
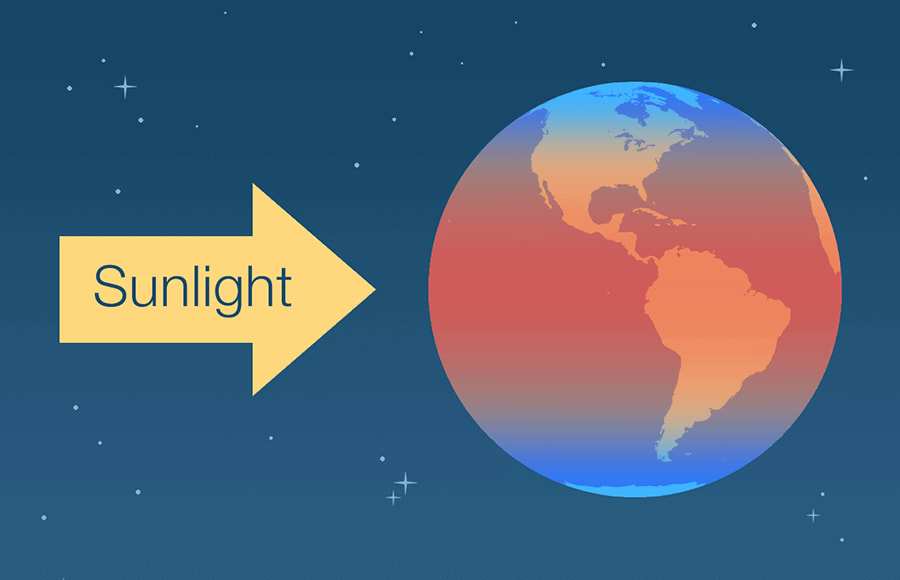
warmer air is less dense than cooler air, which causes it to rise .
The warmer, less dense air around the equater begins rising. Eventually, it reaches the ceiling of the atmosphere, and cannot rise any further, so it must spread out. As the air travels north and south away from its source of heat, it begins cooling, and eventually starts sinking back down to the surface.
Similarly, the cooler air reaches the surface with nowhere else to go except north and south again. So, a portion of the surface air will make a return journey back to the equator. Along the way, the sun heats it again, and the process repeats. This creates a persistent circulation of air around the equator.
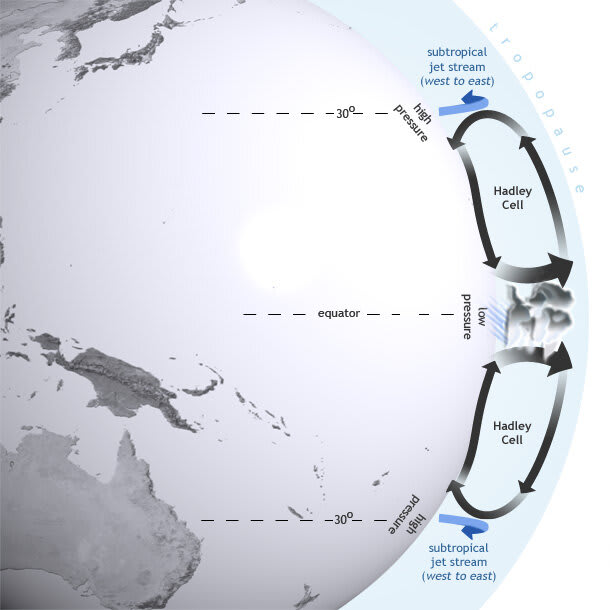
In the animation below, focus on the air movement in the white cloud areas.
Hadley Cell
One (there are actually two ) of the persistent circulations is of particular interest related to ENSO. This is the Hadley Cell. It occurs from rising air at the equator to where air begins sinking, around the 30º latitude north/south.
These circulations (and Hadley Cell specifically) are foundational to ENSO because they creates two important phenomenon we need to explore:
- Jet streams - specifically, the Subtropical Jet Stream created near the 30º latitude
- Surface winds - specifically, the Trade Winds , return winds from 30º latitude back to the equator along a curved path
Subtropical Jet Stream
Wind is formed when air masses with different temperatures intersect. The larger the temperature gradient , the stronger the wind.
Winds that we feel on a day-by-day basis are created by relatively small air masses at the surface. These air masses have smaller temperature gradients and move through an area within days/week.
Jet streams are formed by large air masses high up in the amosphere. These air masses have much larger temperature gradients, and move around much more slowly (weeks and months).
If surface winds are the city streets, jet streams are the super highways in the sky. Jet streams can have wind speeds ranging 100-300mph and play a significant role in moving around air masses, moisture, etc. that make up our day-to-day “weather” .
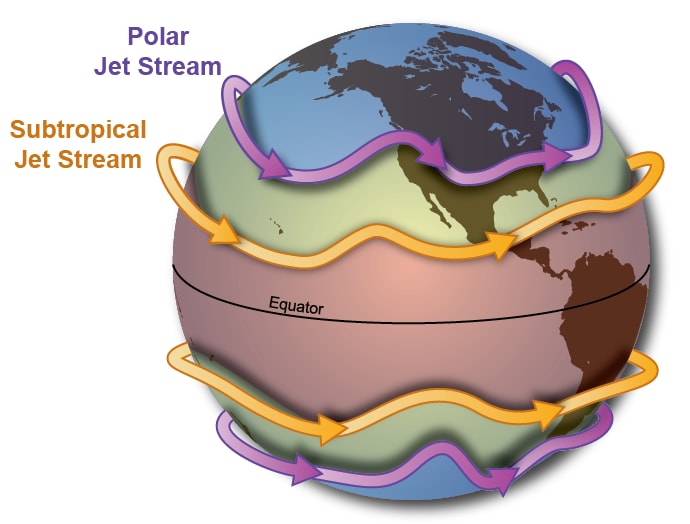
As a result of the Hadley Cell circulation, the Subtropical Jet Stream is formed around the 30º latitude of each hemispheres. The Subtropical Jet Stream is always persistent, but it’s strength and location fluctuate, resulting in stronger weather patterns some years vs. others.
In addition to jet streams, another important wind-related phenomena are the Trade Winds.
Trade Winds
The Trade Winds are the surface winds returning to the equator as part of Hadley Cell. Like the Subtropical Jet Stream, the Trade Winds exist in both hemispheres and originate near the 30º latitude.
As a result of the Coriolis Effect , the Trade Winds follow a curved path.
Refer back to the animation in Image 2. You can see the resulting curved path the Trade Winds take back to the equator. Near the equator, the greatest impact of Coriolis Effect, the winds take on a near east-to-west feel.
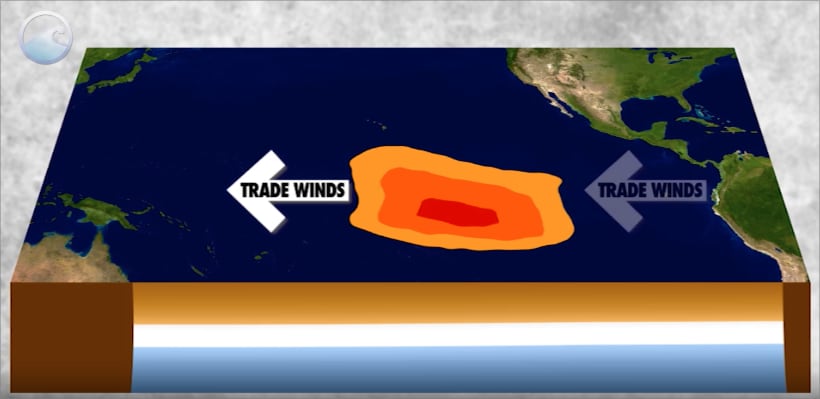
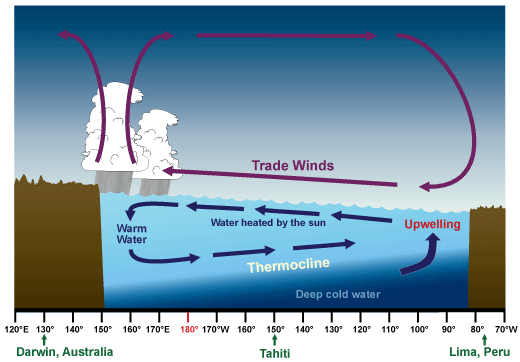
Under normal conditions in the Pacific, the Trade Winds push warm air/water to the west along the equator.
Pacific Walker Circulation
In the early 1900s, Sir Gilbert Walker - a British physicist - discovered a persistent zonal circulation of air across the equitorial Pacific Ocean.
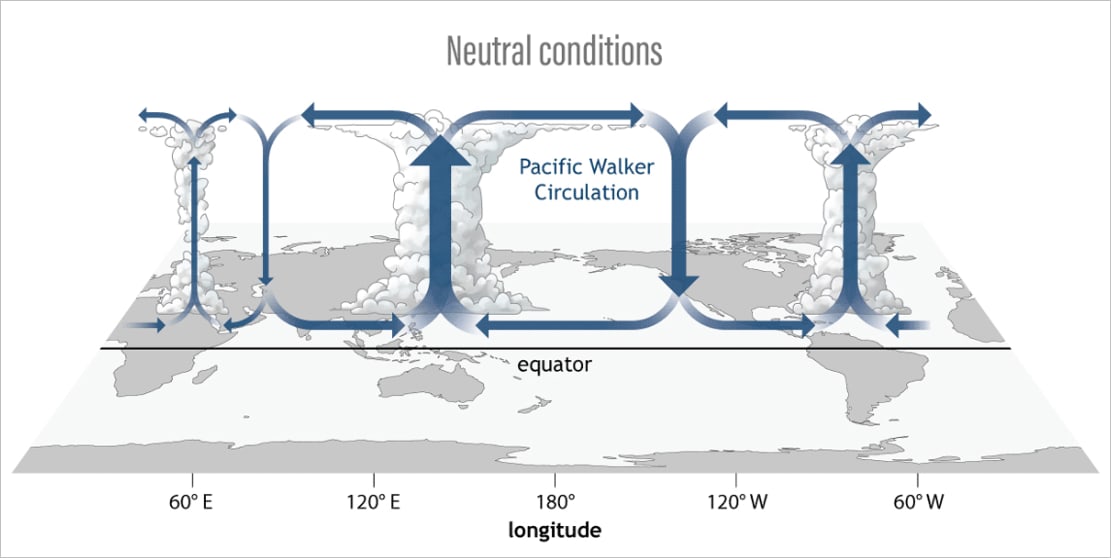
This circulation of air was initially discovered by Walker during his research on monsoons. He found that warmer/less dense air in westner/central Pacific created areas of lower pressure and increase support for deep convection . Further east, this resulted in areas of cooler/sinking air/high pressure. Where these storms intensify has a lot to do with where ideal temperature air/water are pooling in the Pacific.
Sverdrup Transport
A very important phenomena, but something we won’t discuss in depth, are ocean currents. Currents develop as part of an effort to balance the state of the temperature ocean. As warmer air/waters develop in one region, currents will develop to move that warm water to cooler regions.
Sverdrup, named after Harald Sverdrup, is the measurement unit to quantify the volume of ocean water moved by currents. The flow of these currents are constantly measured and offer another perspective to the state of the environment in different parts of the ocean.
Impact on Climate
The fundamental components of our climate (discussed above) are constantly interracting. Knowing how these components are behaving relative to one another helps us understanding when things are closer to average vs. an anomaly.
There is not a single metric to tell us the ‘state of ENSO’. However, there are two important parameters that give us a perspective on the state of the Pacific…you guessed it: ocean temperature and atmospheric pressure .
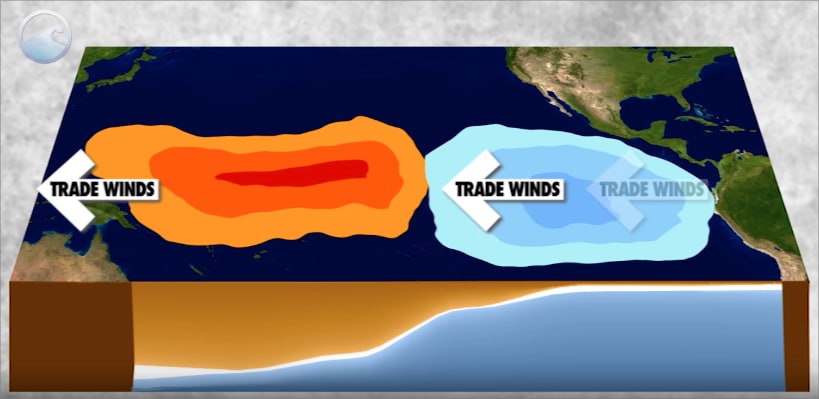
Ocean Temperatures
As Trade Winds push warm air west, it allows for upwelling to occur towards the east. This results in cooler air/waters in the central/eastern Pacific.
This creates a significant temperature gradient from west to east along the equator.
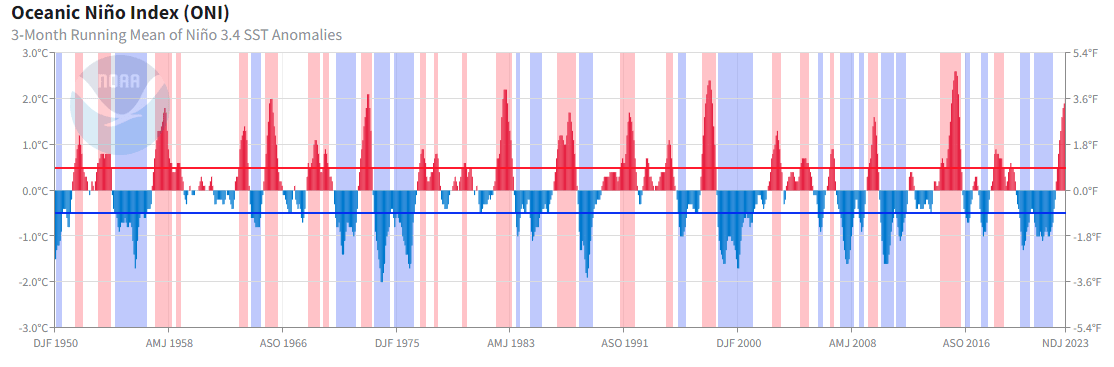
Oceanic Niño Index (ONI)
measuring ocean temperature
The Oceanic Niño Index (ONI) was originally developed while researching fisheries along the equitorial Pacific. ONI uses a 3-month average of Sea Surface Temperatures (SST) to calculate deviation from average temperature . Temperature anomalies help us understand when/where warmer air is pooling.
SST Measurement Regions
- Niño 1+2 : Coast of South America
- Niño 3 : East Pacific
- Niño 3.4 : Central Pacific
- Niño 4 : West Pacific
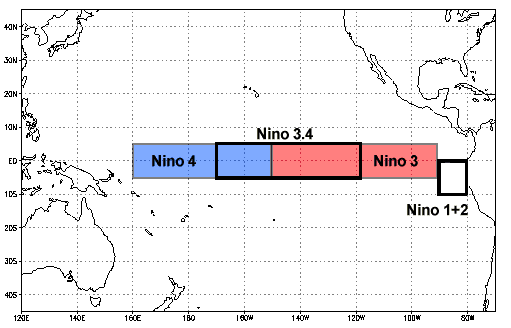
Of these locations, Nino 3.4 is used as the standard region for measure SST impact on ENSO. Temperature in Niño 3.4 changes seasonally, but ranges from 26.5-27.5ºC.
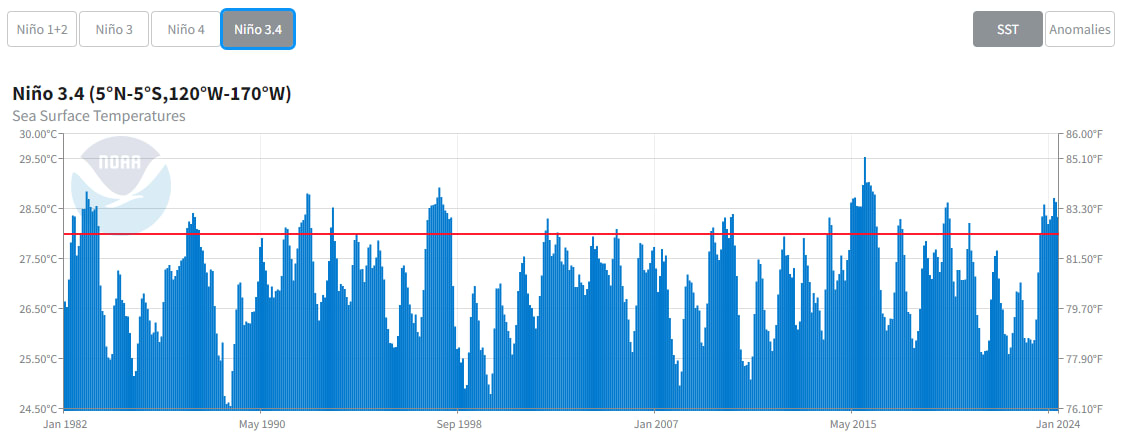
28ºC (~82ºF) is an important measurement threshold because it is a ‘sweet spot’ supporting deep storm development - which has a large impact on the Walker Circulation and Subtropical Jet Stream strength and location.
A sustained temperature differences of only ±0.5ºC in Niño 3.4 means the enhanced ‘sweet spot’ loacations (storm development) may be shifting west or east of normal.
Atmospheric Pressure
Warm air pushed west by the Trade Winds continues to be heated by the sun. This creates an area of lower pressure , where it begins rising. The rising air eventually reaches the top of the atmosphere, and - similar to the Hadley Cell - flows back to areas of cooler air…in this case the central Pacific.
Along its return journey, air cools and begins sinking, which creates an area of higher pressure in the eastern/central Pacific.
As the air sinks, it is picked up by the surface Trade Winds and pushed back west (again), where it is re-heated by the sun…and the whole process repeats.
The greatest air of warm, rising air, supports convection . The stronger these storms and their location have a direct impact on the strength and location of the Subtropical Jet Stream.
Southern Oscillation Index (SOI)
measuring atmospheric pressure
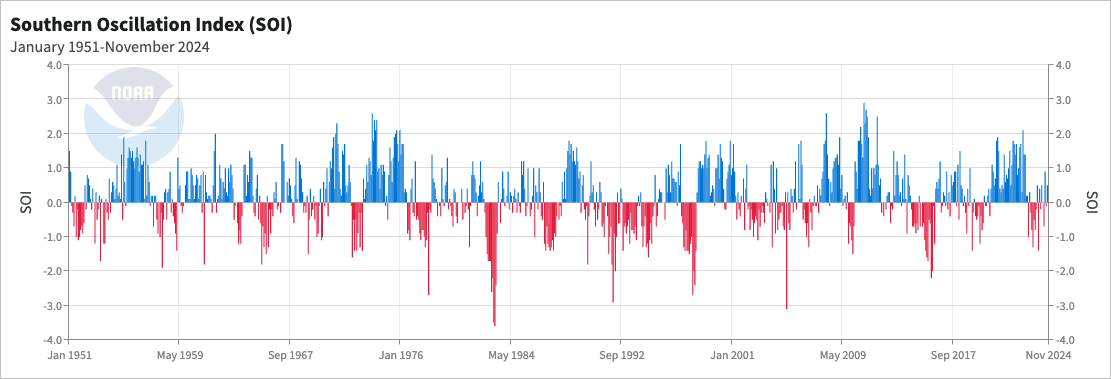
The Southern Oscillation Index (SOI) was originally developed while researching monsoons in western Pacific. The calculation is the standardized pressure difference between west and east regions of the Pacific.
Climate stations have been established in two key locations - Darwin, Australia (west) and Tahiti, French Polynesia (east) - to monitor the conditions and calculate SOI values.
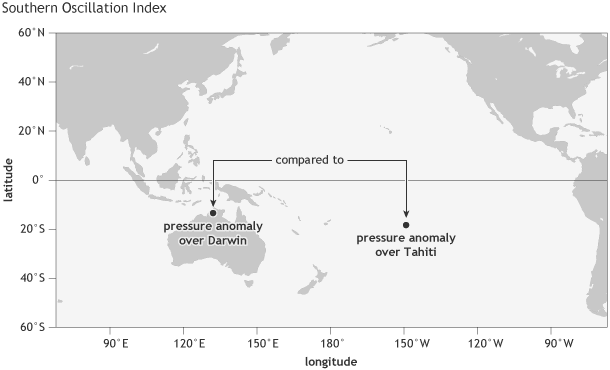
Pressure between the regions is not directly opposite the another. Meaning, when the west decreases pressure, the east does not equally increase pressure. Each region is evaluated against its own historical average. Then, a standard deviation is calculated based on comparison of the two regions.
The resulting SOI value ranges from ± 2-3 mb, where sustained ± 0.7 mb is considered an anomaly.
The image below shows an example of two different time periods with different SOI values.
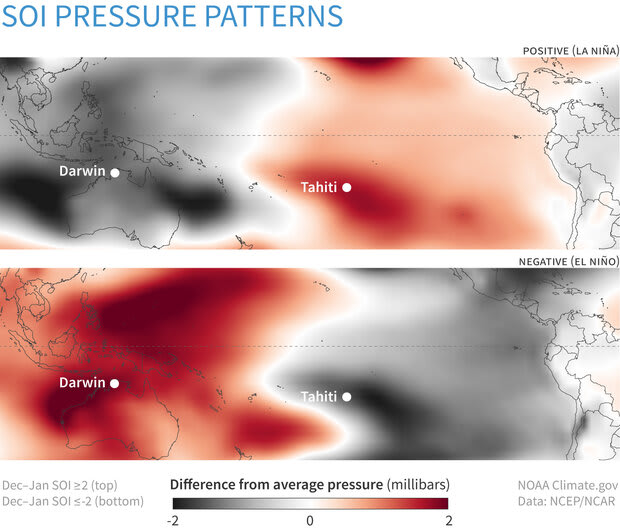
As relative pressure in west or east deviate from normal , this can be an indication of enhanced support (or not) for storms in those regions.
Convection
Convection in the Pacific plays a critical role in the Pacific climate having several downstream impacts. Deep convection in the west can enhance the Walker Circulation and drive stronger Trade Winds. Whereas weaker convection or a shift to the east can weaken the Walker Circulation and lead to slowing of Trade Winds.
Outgoing Longwave Radiation (OLR)
With modern satellite technology, scientists can measure thunderstorm activity by monitoring the amount of radiation given off from the tops of the storms.
Thermocline
The Thermocline is the rate at which temperature changes in large areas of the ocean. Thanks again to our Trade Winds, surface water heated from the sun can pool up in areas like the west which causing the depth of that warm water to increase. If you were to draw a line of temperature, it would look like an angle. The depth of warm/cool water, the rate at which it changes is the thermocline
Bjerknes Feedback
While Sir Walker is credited with early discovery of zonal circulation in the Pacific, it wasn’t until the 1960’s that Jacob Bjerknes discovered it’s link to temperature and impact and link to ENSO.
Bjerknes found that a stronger temperature gradient could intensify the Walker Circulation. As the Walker Circulation increased, it created a stronger pressure gradient and in turn, a stronger difference in temperatures. Essentially, both phenomena fed off of one another in a feedback loop.
This feedback loop helps these phenomena operate in a sort of harmonious way to create the normal state of our climate.
It’s important to remember that these processes are all interrelated to one another. You can infer some cause an effect, but recall that the environment is always trying to balance itself out.
Despite constant change of these components, scientists have calculated an average or normal state of the climate. Most of the component described above were done so (intentionally) using conditions that support a normal state. However, it does not mean that all of these conditions occur exactly at the same time.
State of ENSO
Brief History of ENSO
The 1600’s might contain the earliest documentation of El Niño events. Fishermen off the coast of South America wrote about warming of the waters which typically occurred around Christmas time. They named this phenomenon 'El Niño' .
La Niña didn’t become popularized until much more recently, around the 1900’s when the first documented La Niña episodes went on record.
The prediction of ENSO is actually a relatively new science too, only since the 1960’s/1970’s.
Surprisingly, the initiation of any one ENSO episode is still somewhat of a mystery. We know a lot more about how these phases interract with each other and ultimately reach their demise (return to normal).
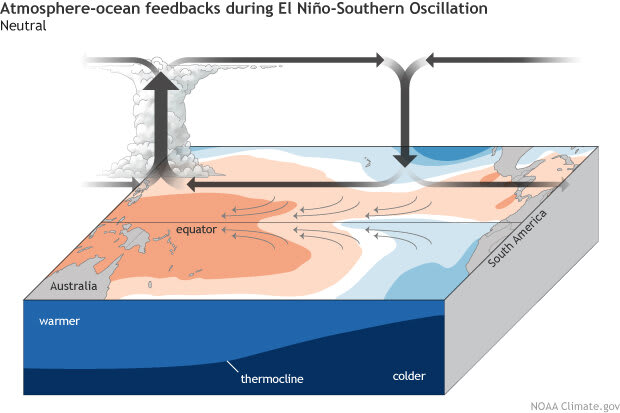
ENSO Neutral
the average or normal state
Over years of research, a baseline average for temperatures and atmospheric pressure has been recorded to describe when the climate is behaving in an average state, we call this phase: ENSO Neutral
During ENSO Neutral:
- Trade Winds operate at normal speeds, creating a normal concentration of warmer air/water in west Pacific (west: warm, east/central: cool)
- The Walker Circulation is strong which helps maintain a normal pressure gradient (west: low, east/central: high)
- Convection: normal convection in western Pacific supports Walker Circulation
- Temperatures: Niño 3.4 near 27ºC
- Pressure: within ± 2 millibar (normalized) between Darwin and Tahiti.
- Thermocline: normal tilt supporting adequate upwelling and cool water transport to balance western warm pools
ENSO Neutral Weather
- Maritime: Normal storm (monsoon) development occurs in western Pacific.
- Subtropical Jet Stream: normal speed in baseline position.
- Polar Jet Stream: Normal flow/position controlling arctic air
- USA North (winter): Variable weather, seasonal average temperatures, nomrl probability of arctic air intrusion, standard preciptation patterns and storms
- USA South (winter): Normal Gulf of Mexico precipitation transport, normal storm development
La Niña
an even stronger (cooler) neutral
When Trade Winds are stronger than normal, they will push even more warm air west, allowing more upwelling of cold air in central/eastern Pacific. If central/eastern Pacific SSTs cool -0.5ºC from average over a sustained period, we identify this as La Niña .
During La Niña:
- The Trade Winds are stronger than usual, blowing warm waters FURTHER west (west: warmer, east/central: cooler)
- Enhanced Walker Circulation due to warmer air available in the west.
- Convection: stronger convection west, enhances the Walker Circulation and strengthens Trade Winds
- Temperatures: at least 0.5º C below 28º C for 5 overlapping 3-month periods
- Pressure: SOI value near +0.7 or more
- Thermocline: steeper tilt due to more water in west, strong upwelling
La Niña Weather
- Maritime: enhanced convection and storms over areas like Indonesia.
- Subtropical Jet Stream: weaker, allowing Arctic air masses via variabile Polar Jet Stream
- Polar Jet Stream: more variabile, allowing more arctic air intrusion in northern latitudes
- USA North (winter): cooler temperatures and increased preciptation, greater variability in storms
- USA South (winter): warmer temperatures, significantly decreased precipitiation, reduced frontal activity
EL Niño
opposite of neutral
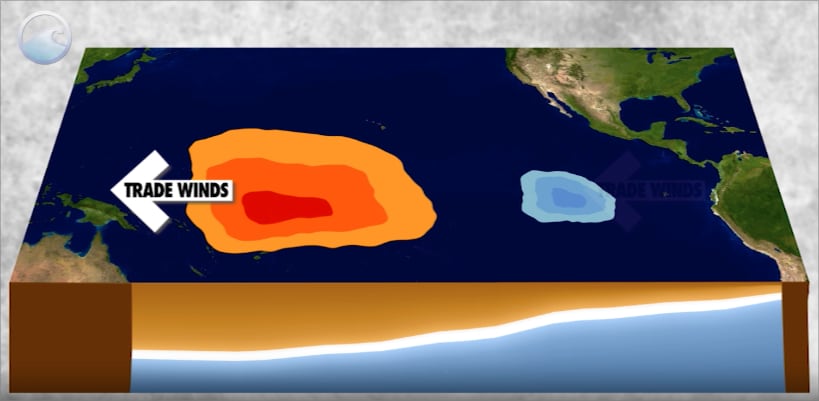
When the Trade Winds slow enough to let warm water pool up in the central Pacific, SSTs there will measure warmer than average. When temperatures are consistently +0.5ºC warmer for a sustained period, we identify this as El Niño .
During El Niño:
- The Trade Winds are much weaker (or reversed!) than normal, allowing warm water to pool in the central Pacific (west: cooler than normal, east/central: warmer than normal)
- Walker Circulation: weaker due to less warm air/water concentration in west
- Convection: convection pushes east, weakens the Walker Circulation and Trade Winds
- Temperatures: at least 0.5ºC above 28ºC (but typically +1ºC to +3ºC) for 5 overlapping 3-month periods
- Pressure: SOI value near +0.7 or more
- Thermocline: flat due to more warm water in west/central, weak upwelling
El Niño Weather
- Maritime: reduced convection and storms over areas like Indonesia.
- Subtropical Jet Stream: stronger, reduced Arctic air via Polar Jet Stream
- Polar Jet Stream: more variabile, allowing more arctic air intrusion in northern latitudes
- USA North (winter): warmer temperatures and decreased preciptation, greater variability in storms
- USA South (winter): cooler temperatures, significantly increased precipitiation, enhanced Pacific and Gulf storm tracks
Summary
| Neutral | La Niña | El Niño | |
|---|---|---|---|
| ONI (Nino 3.4 SST) | Normal (26-27ºC) | Cooler (26ºC) | Warmer (27-29ºC) |
| SOI (index) | Normal (-0.7 to +0.7) | Higher (+0.7 to >2.0) | Lower (<2.0 to -0.7) |
| Darwin SLP (West) | Normal (1010) | Lower (~1009) | Higher (~1011) |
| Tahiti SLP (East) | Normal (1013) | Higher (~1014) | Lower (~1012) |
| Trade Winds | Normal (10-15kts) | Stronger (10-20kts) | Weaker/Reversed (0-10kts) |
| Walker Circulation | Normal | Stronger | Weaker |
| Convection | Normal | Enhanced/West | Weaker/East |
| Subtropical Jet Stream | Normal | Weaker/North | Enhanced/South |
| WEATHER IMPACT: | |||
| USA North | Average Temps/Precip | Cooler/Wetter winter | Warmer/Drier winter |
| USA South | Average Temps/Precip | Warmer/Drier winter | Cooler/Wetter winter |
| Pacific Hurricane | Average | Decrease | Increase |
| Atlantic Hurricane | Average | Increase | Decrease |
| Maritime (Indonesia) | Average | Enhanced | Drought |
| UK | Normal | Milder winter Incr prob storms | Cooler winter Strong El Niño=warmer |
| Africa | Normal Monsoon | Increase | Decrease |
Resources
Prediction Summary
Climate Prediction Center - Monthly Ocean Briefing
NOAA Climate Prediction Center – Synopsis
NOAA Climate Prediction Center – Prognostic (detailed) Discussion
Forecasts
NOAA Climate Prediction Center – Probabilities by 3-Month
NOAA Climate Prediction Center – Three Month Outlooks
NOAA Climate Prediction Center – Consolidate SSTs Forecast
Measurement